Do you work with VHH or nanobodies?
Do you use computational tools to design or optimize CDR loops?
Do you use phage display or yeast display to screen your candidates?
If your answer to all three questions is yes, then you might have just found the best tool to power up your discovery!
Explore the Untapped Combinations
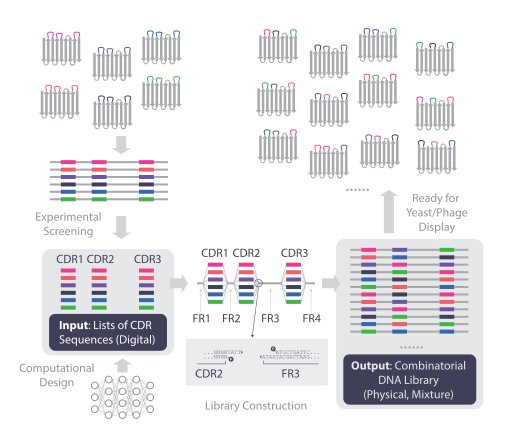
VHH discovery campaigns – whether through experimental immunization, phage/yeast display panning, or computational design – typically produce a list of hit sequences that share a common framework but differ in their CDR1, CDR2, and CDR3 loops. Each hit was selected or designed as a complete unit, but there is no guarantee that the CDR combination within each hit is optimal. A CDR1 from one hit may pair beautifully with a CDR3 from a completely different candidate – a combination that was never tested.
The same logic applies when AI algorithms optimize each CDR loop independently and nominate improvements separately – combining the best CDR1, CDR2, and CDR3 candidates is a natural next step.
We call this process combinatorial CDR shuffling. The unexplored space can be large but tractable. Random combination of 100 CDR1 variants $\times$ 100 CDR2 variants $\times$ 100 CDR3 variants = $10^6$ unique sequences. Modern display-based screening can easily handle $10^6$–$10^8$ library members, so the screening capacity is not the bottleneck.
The bottleneck is building the DNA pool. Prescribing every combination individually and synthesizing them as an oligo pool is obviously not cost-effective at the $10^6$ scale. Experimental randomization is the way to go – but how?
In our mind the best approach is to synthesize each CDR region as a high-quality, uniform oligo pool containing only the designed candidate sequences, then use a controlled random assembly to produce the full-length combinatorial library. This is exactly how the RootPath VHH CDR Shuffler™ works (see Figure 1).
How It Works
The input is simple: you provide three lists of CDR sequences (CDR1, CDR2, CDR3) and the four framework sequences (FR1, FR2, FR3, FR4). Each CDR list can contain as few as 1 and as many as 100,000 unique sequences. We take care of the rest, specifically:
Step 1: Oligo Pool and Fragments Synthesis. We synthesize the framework fragments (FR1, FR2, FR3, FR4) as clonal, sequence-verified DNA. The CDR sequences are synthesized as non-clonal oligo pools – one pool per CDR region.
Step 2: Golden Gate-like Assembly. The framework fragments and CDR oligo pools are all flanked with BsaI sites and sequentially compatible sticky ends. They are assembled using a 1-step Golden Gate-like ligation. The use of Golden Gate-like Assembly (as opposed to Gibson Assembly or overlapping PCR) is a key design choice. Golden Gate uses Type IIS restriction enzymes to generate defined, short, non-palindromic overhangs, which means each CDR slots into its correct position without ambiguity. The ligation is highly efficient and introduces little to no bias toward certain sequences.
Step 3: Amplification. The ligation product is briefly PCR-amplified to form the final double-stranded DNA (dsDNA) pool. The result is a combinatorial library where every CDR1 $\times$ CDR2 $\times$ CDR3 combination is represented.
The entire process can be completed in as short as 5 business days after sequence confirmation. When you order for the first time, and we need to prepare each framework fragment as clonal, sequence-verified plasmids, we need to take 2 to 3 extra days. But for ensuing orders using the same sets of framework fragments, 5 business days are sufficient.
NGS Characterization Results
To verify that the assembly process performs as expected, we characterized the assembly product by next-generation sequencing (NGS). The following sections walk through the results from a proof-of-concept library containing 1,191 CDR1, 1,172 CDR2, and 1,400 CDR3 designed variants – a combinatorial space of nearly 2 billion unique sequences.
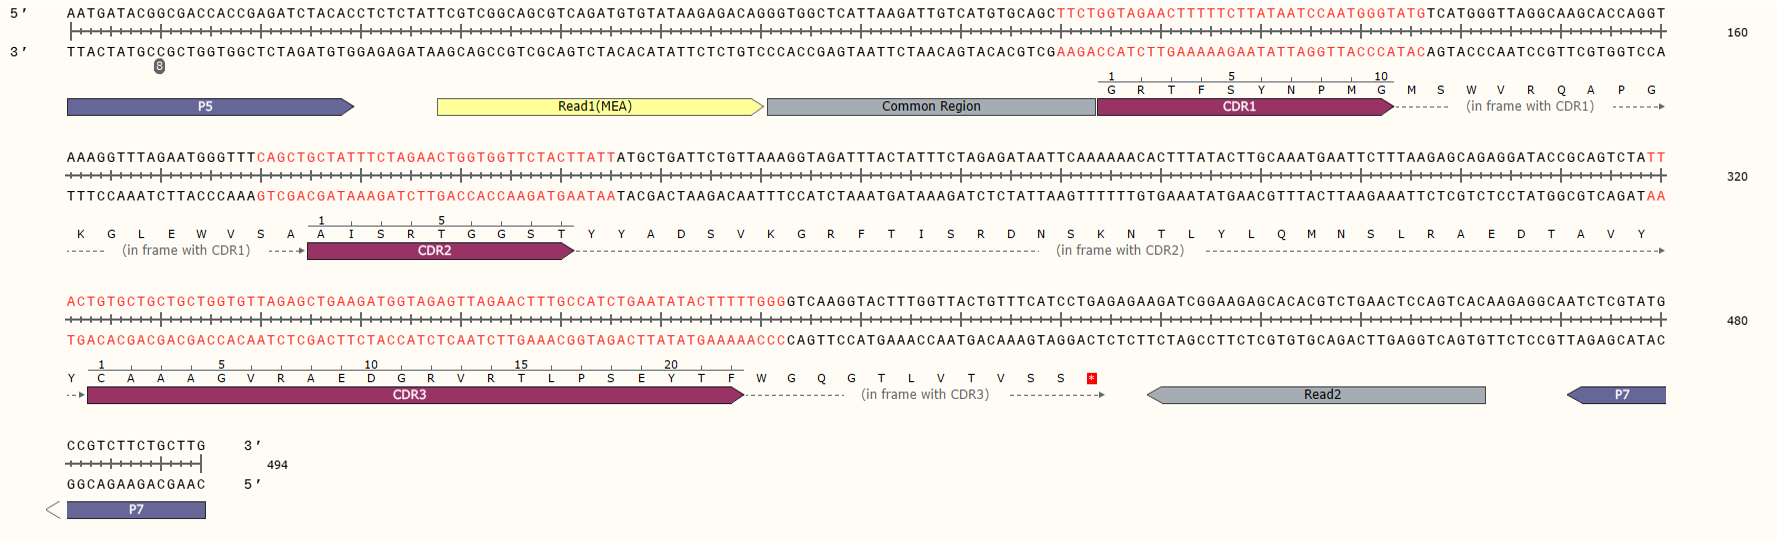
Thanks to the manageable lengths and favorable positions of CDRs and FRs in VHH, we can sequence all of CDR1 and CDR2 in Read 1 and CDR3 in Read 2 in a typical paired-end 150-bp each (PE150) NGS run. We simply need to amplify the VHH library using adaptor-containing forward and reverse primers targeting the FR1 and FR3 regions, respectively, to obtain libraries shown in Figure 2.
Sequence Fidelity
Because CDR oligos are chemically synthesized, single-base deletions and point mutations are unavoidable error modes. We quantify both by extracting CDR inserts from paired-end NGS reads and comparing them to the designed sequences.
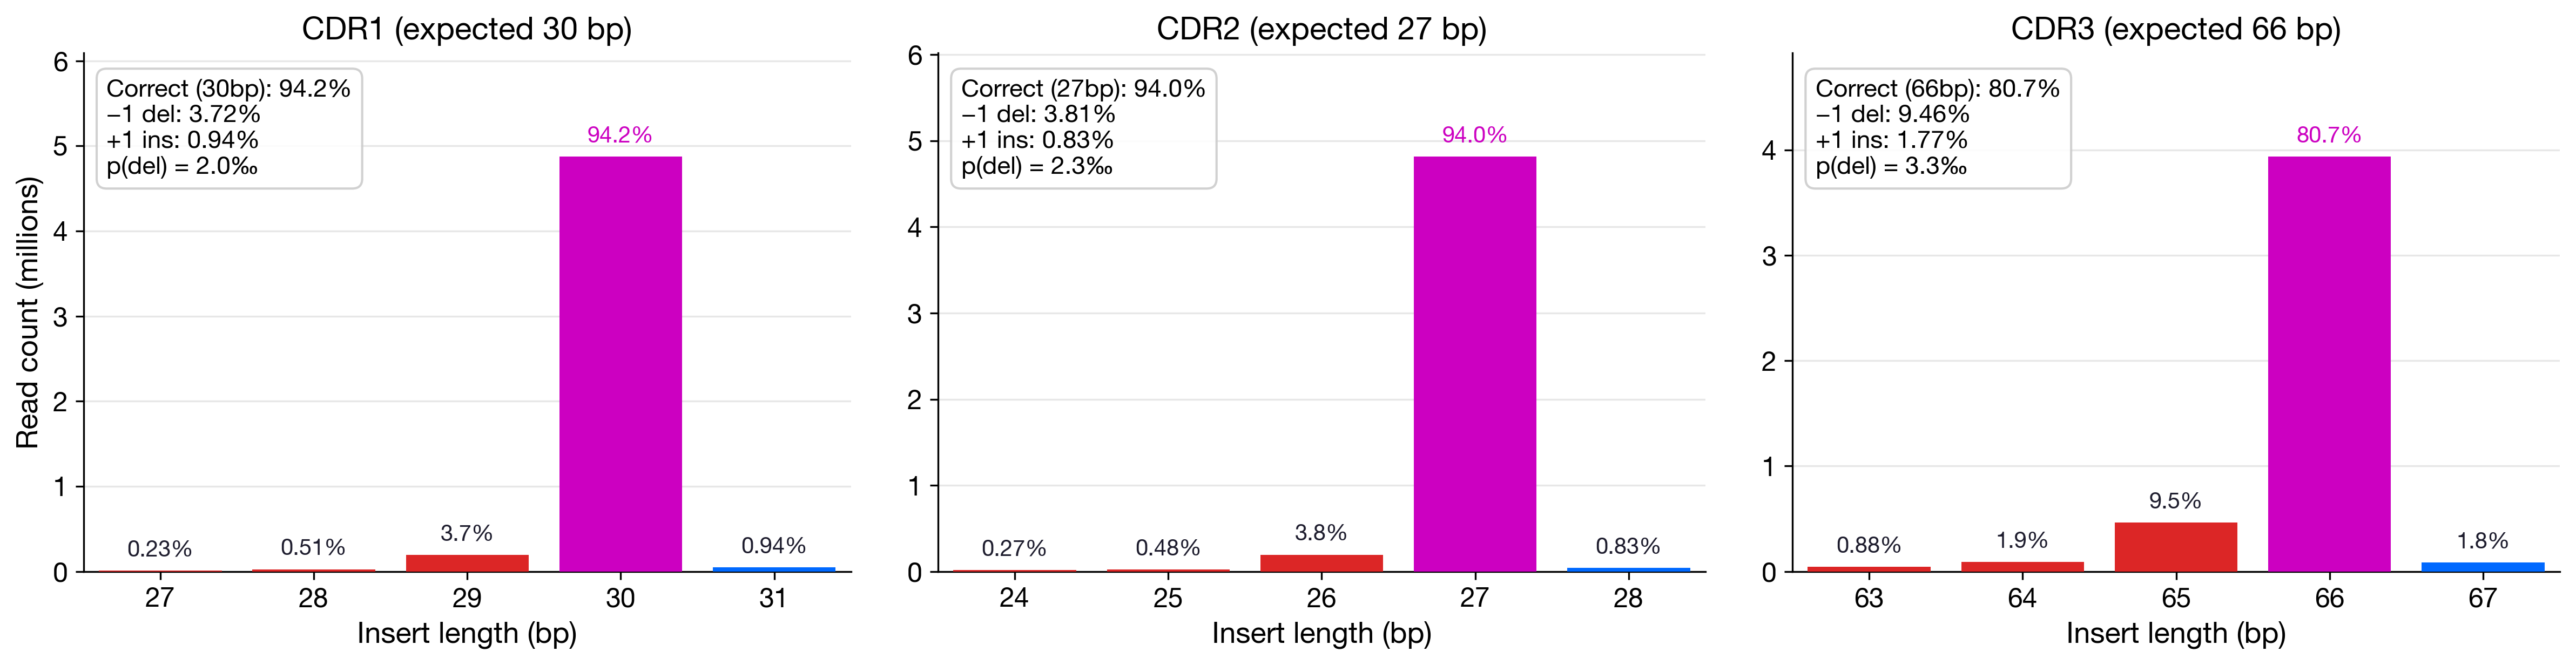
Length fidelity. The vast majority of reads carry the correct CDR length: 94.2% for CDR1, 94.0% for CDR2, and 80.7% for CDR3 (Figure 3). The dominant error mode is single-base deletion (−1), with per-base deletion rates of 2.0–3.3‰ – consistent with state-of-the-art oligo synthesis. Since all three CDRs must be in-frame for a functional VHH, the overall fraction of fully in-frame DNA molecules is approximately 94.2% $\times$ 94% $\times$ 80.7% ≈ 72%.
Sequence fidelity. Among correct-length reads, we classify each CDR insert as “in-design” (exact nucleotide match to a designed variant) or “out-of-design” (sequence does not match any of the designed variants).
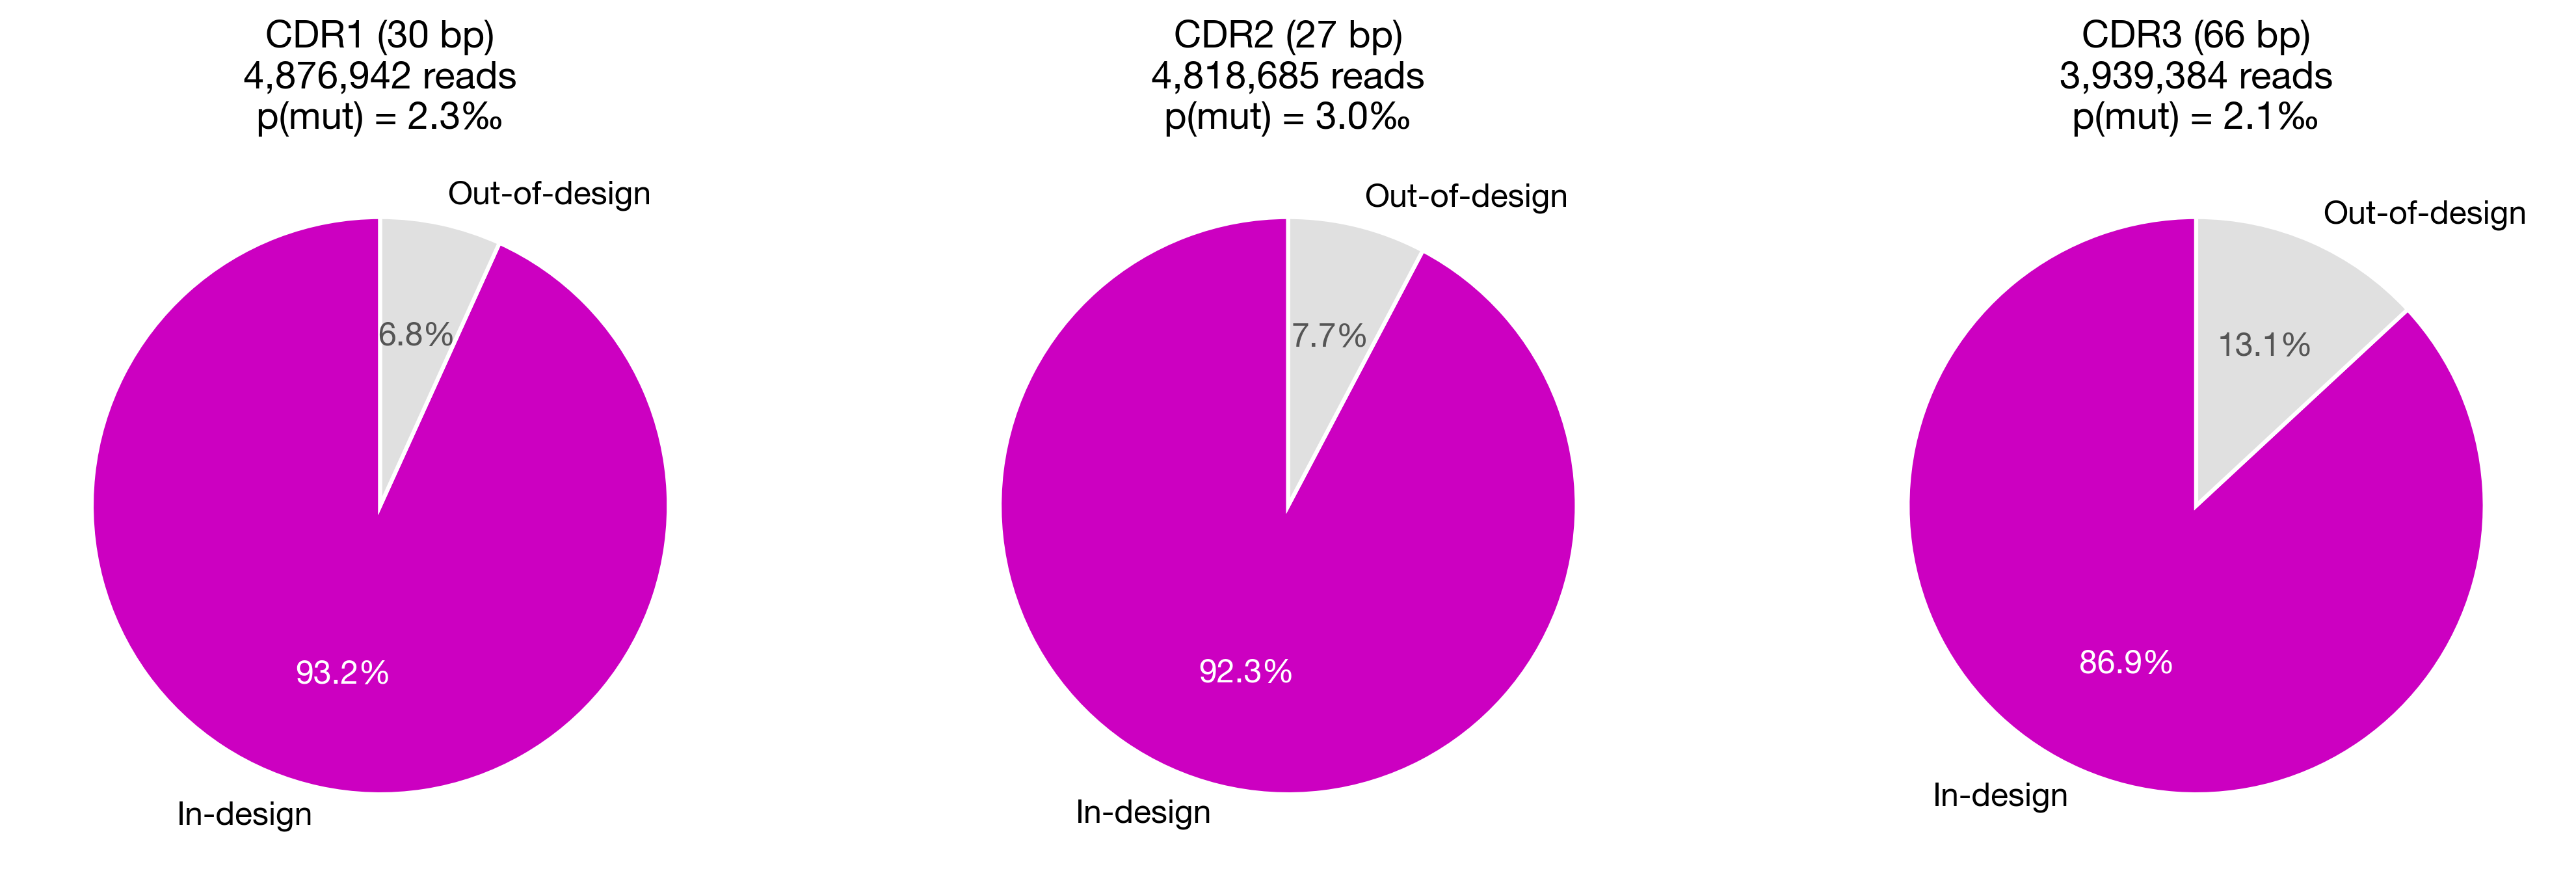
As shown in Figure 4, 93.2% of correct-length CDR1 reads, 92.3% of CDR2, and 86.9% of CDR3 match a designed sequence exactly. The out-of-design fractions overestimate the true synthesis error rate because Illumina sequencing errors (~0.1% per base) also contribute. Nonetheless, the derived per-base substitution rates of 2.1–3.0‰ are in line with state-of-the-art oligo synthesis.
Putting it all together: at least 72% $\times$ 93.2% $\times$ 92.3% $\times$ 86.9% ≈ 54% of DNA molecules carry all three CDRs both in-frame and matching a designed sequence. This is a conservative lower bound – the true fraction is higher once sequencing errors are accounted for. For display-based screening where $10^6$–$10^8$ transformants are routine, the vast majority of designed combinations will be well-represented in the functional library. And the correct-length out-of-design sequences are still in-frame – bonus diversity that your screen gets to explore for free. In a later section I will discuss the origin of these out-of-design sequences (spoiler alert: they are not all random synthesis or amplification errors).
Uniformity of Variants
A combinatorial pool is only as good as its uniformity. If certain CDR sequences are over- or under-represented, you’re not actually sampling the full combinatorial space – you’re sampling a biased subset. The rank-abundance plot below shows per-variant read counts for in-design sequences, sorted from most to least abundant.
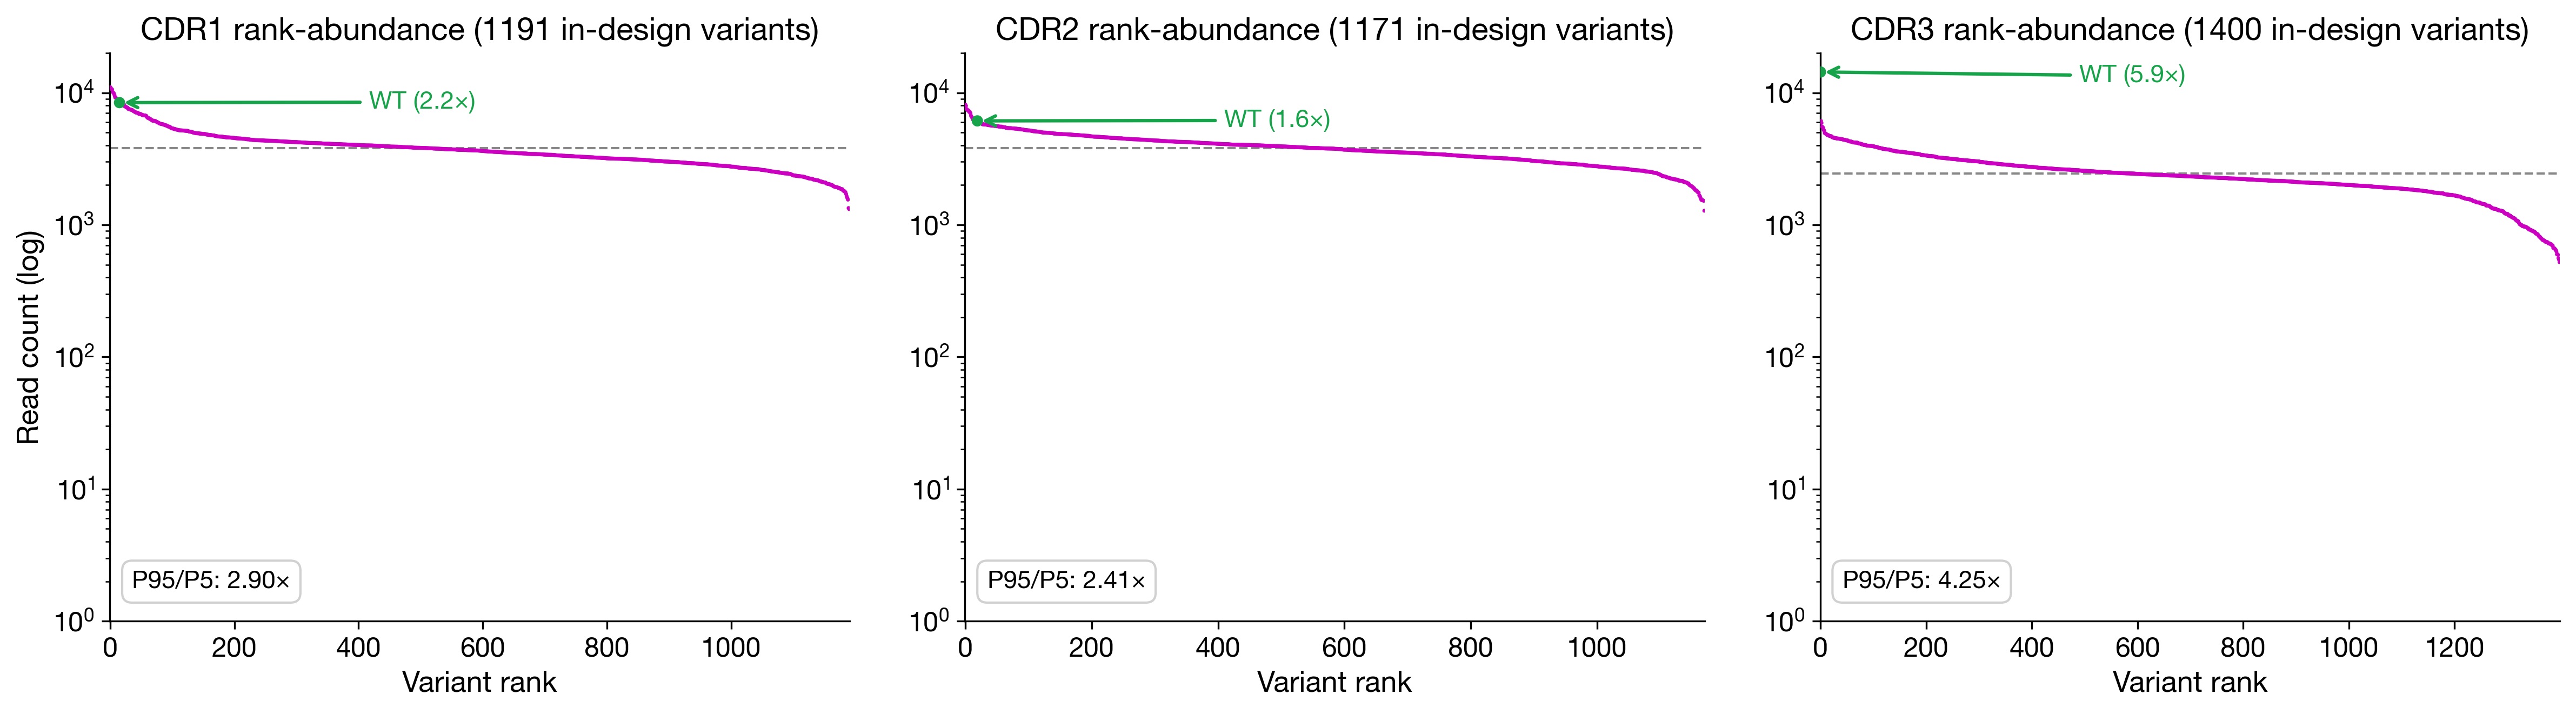
The distributions are remarkably tight: the P95/P5 ratio ranges from 2.4× (CDR2) to 4.3× (CDR3), meaning the middle 90% of variants fall within a roughly 3-fold range (Figure 5). CDR2, the shortest region (27 bp), is the most uniform – consistent with shorter oligos having more predictable synthesis behavior.
One notable feature is the wild-type (WT) sequence, over-represented by 1.6× (CDR2) to 5.9× (CDR3) relative to the expected frequency. Despite this enrichment, WT accounts for only 0.14–0.42% of in-design reads – a negligible fraction. Nevertheless, this enrichment of WT is curious, to say the least. It is not due to template contamination: the library is assembled entirely from synthetic components with no WT template present. One hypothesis we have is that, during PCR amplification of the pool, some chimera may be created. Namely, if a top strand is incompletely extended, and a bottom strand is incompletely extended, these two molecules may hybridize onto each other and get extended to form the full-length product. Since the sequences are mostly wild-type with occasional mutations sprinkled around, the chimeras are more likely to be wild-type.
What Are the Out-of-Design Sequences?
Could some of the out-of-design sequences also be PCR chimeras – recombinant sequences that combine mutations from two different parent oligos?
To test this, we aligned each out-of-design sequence to the WT reference and asked: can its mutations be explained as a spatial fusion of two designed variants? We looked for a crossover point such that the mutations on the left exactly match one designed variant and those on the right exactly match another, and classified chimeras by parent type: “1+1” (two single-mutant parents) and “1+2” (one single-mutant + one double-mutant parent).
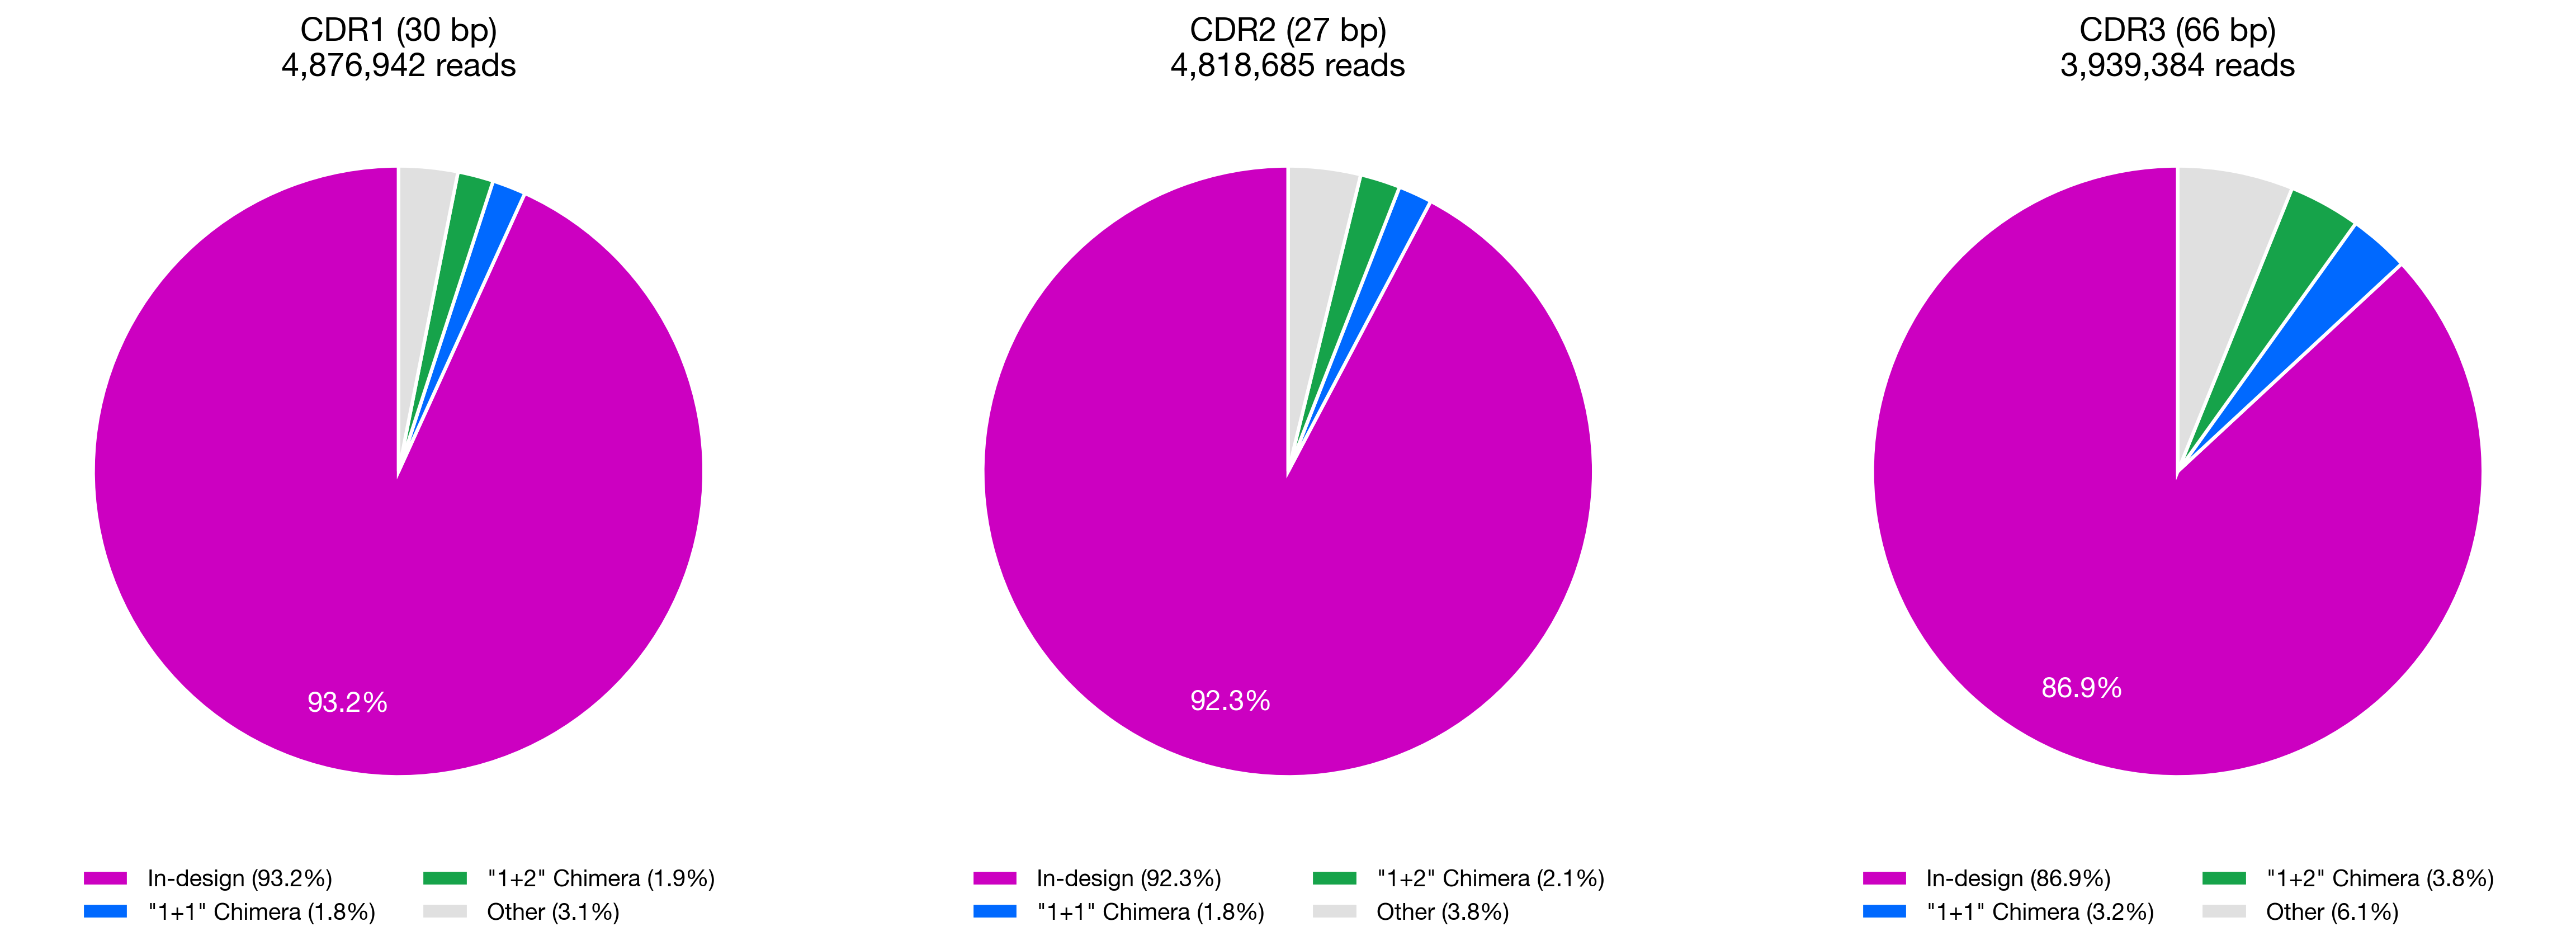
Identifiable chimeras (“1+1” + “1+2”) account for 3.7% of correct-length CDR1 reads, 3.9% of CDR2, and 7.0% of CDR3 (Figure 6). These fractions scale with CDR length, as expected: longer amplicons provide more opportunities for template switching. Importantly, chimeric sequences are still in-frame – they carry novel combinations of designed mutations, representing additional functional diversity.
The “Other” category (3.1–6.1%) includes sequences with at least one novel mutation, likely arising from Illumina sequencing errors, oligo synthesis point mutations, and higher-order chimeras involving three or more parents.
Randomness of CDR Combinations
The whole point of a combinatorial pool is that every CDR1 $\times$ CDR2 $\times$ CDR3 combination has an equal chance of being represented. If the assembly introduced systematic biases – for example, if certain CDR1 variants preferentially co-occurred with certain CDR2 variants – you wouldn’t be exploring the full combinatorial space.
Under random assembly, the number of times a specific (CDR1$_i$, CDR2$_j$) pair appears should follow a Poisson distribution with rate $\lambda_{ij} = N \times f_i \times f_j$, where $f_i$ and $f_j$ are the marginal frequencies and $N$ is the total number of reads. The pair frequency should be entirely predicted by the individual CDR frequencies, with no additional correlation.
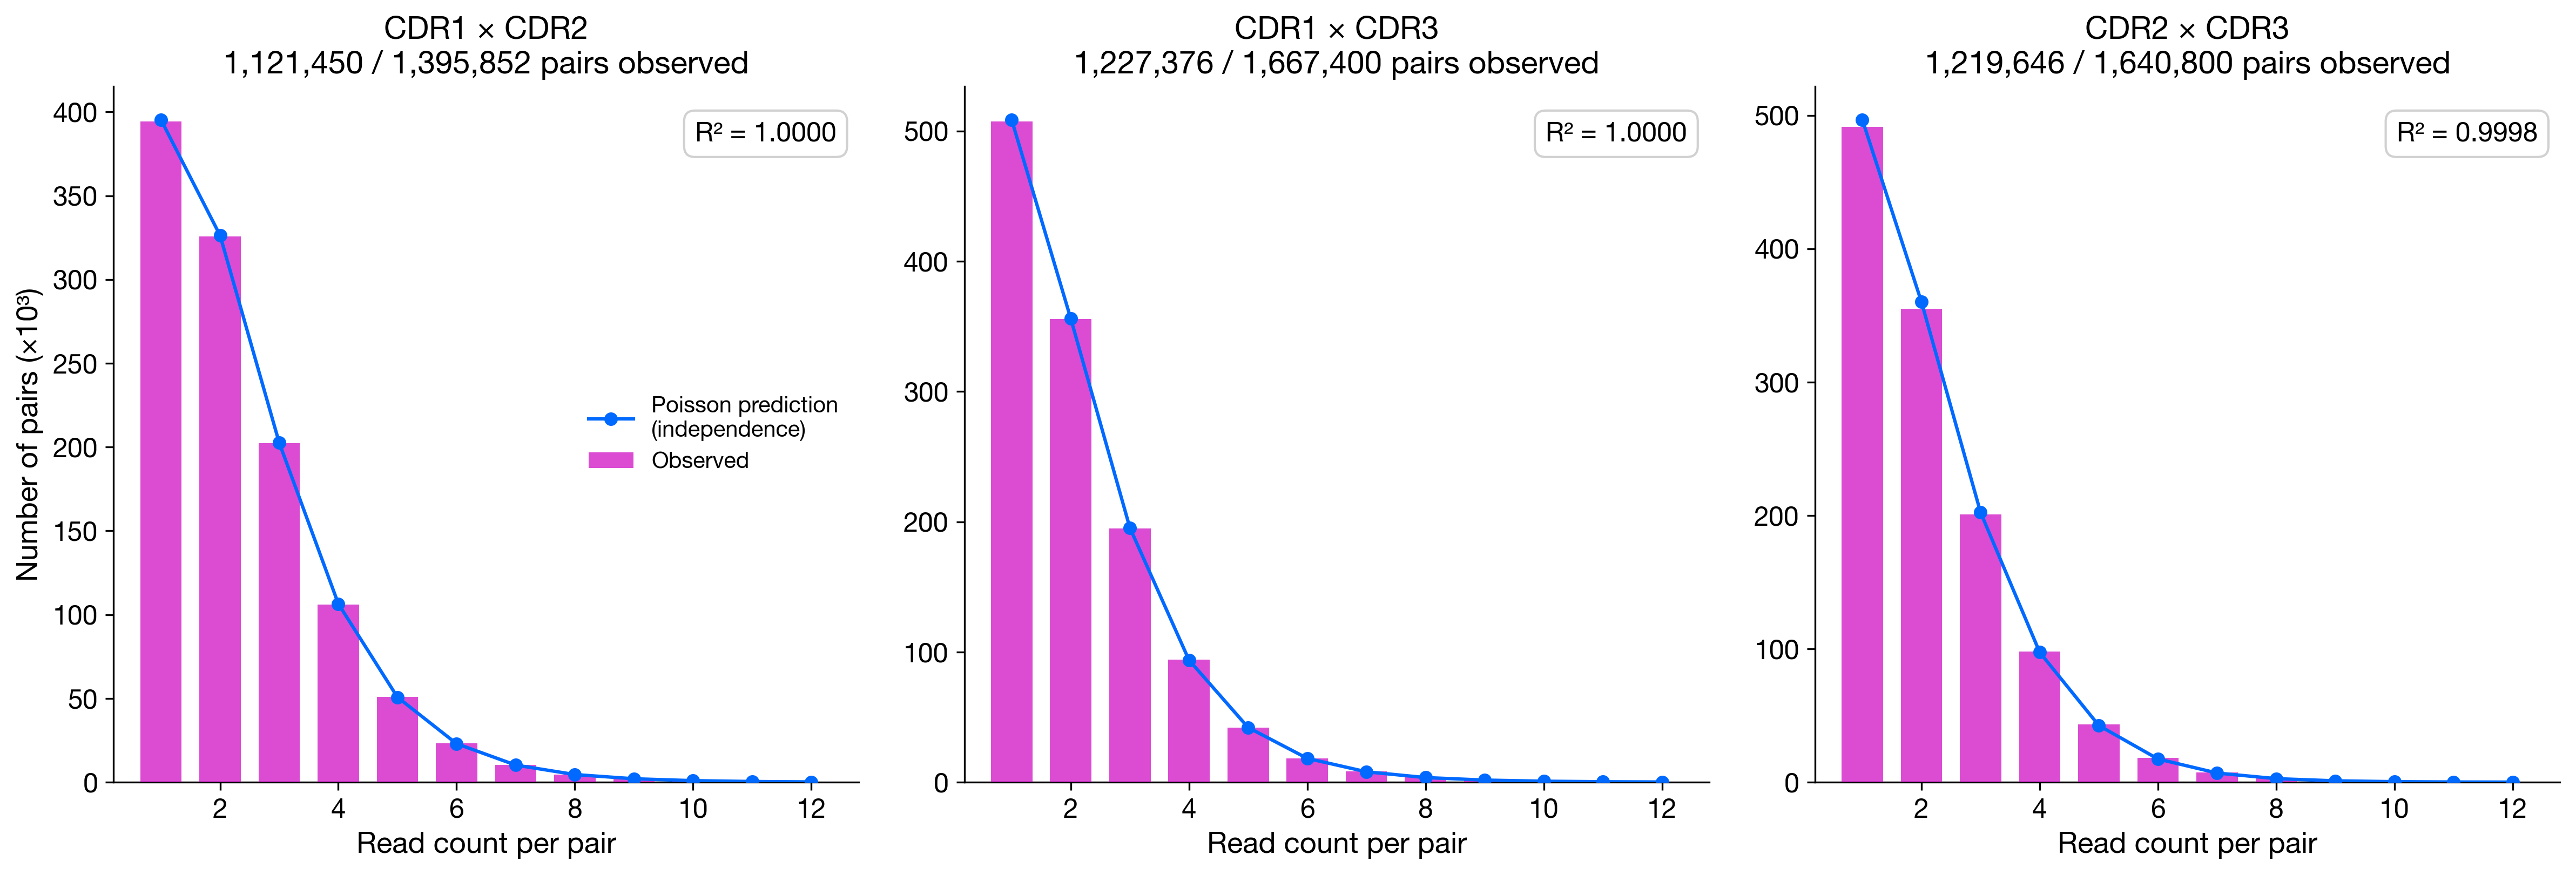
The observed pair-count distributions match the Poisson predictions almost exactly (R² $\geq$ 0.9998 for all three pairwise comparisons, Figure 7). The Golden Gate assembly introduces no detectable bias in CDR pairing – each CDR slot is assembled independently of the others.
At the triple level, the combinatorial space is enormous: 1,191 $\times$ 1,172 $\times$ 1,400 $\approx$ 1.95 billion possible combinations. Among 2.62 million reads where all three CDRs were classified as in-design, 99.5% carried a unique triple – consistent with sparse random sampling from a truly combinatorial pool. Even at this modest sequencing depth, 74–80% of all possible pairwise combinations were already observed at least once, confirming broad and unbiased coverage.
What To Order
In addition to the pool synthesis, you can also order the NGS characterization as shown above. We offer 10 M reads, 50 M reads and 500 M reads scales. You can choose according to the complexity of your pool. We also offer cloning the pool into a plasmid backbone via large-scale electroporation so that you can directly transform the product into E.coli or yeast. We currently offer $10^5$ colony-forming units (CFU) and $10^6$ CFU scale transformations.
While the CDR Shuffler™ library explores the combinatorial space of your existing CDR sequences, single-point variants in the framework regions may also result in functional improvements. Our Single-point SSV™ (site-saturation variant) library complements the CDR Shuffler™ by generating all possible single-point mutations across the entire VHH sequence. This complements the CDR Shuffler™ and help you access a wider sequence space. You can order these two libraries together to enjoy a 15% bundle discount.
Getting Started
All you need to provide is:
- Three lists of CDR sequences (CDR1, CDR2, CDR3), in any standard format
- The four framework sequences (FR1, FR2, FR3, FR4)
- Optionally, preferred vector backbone
That’s it. We handle the molecular design, synthesis, assembly, and QC.
If you’re interested, feel free to email me at xi@rootpathgx.com, or schedule an online meeting to discuss your project. We’d love to help you find winning CDR combinations!
– Xi Chen